Evidence & understanding / See it
Use See it to turn a concept into a visual study guide
Choose a diagram shape for the relationship you want to understand, then verify labels, arrows and numerical ranges against sources.
Name the relationship you want to see
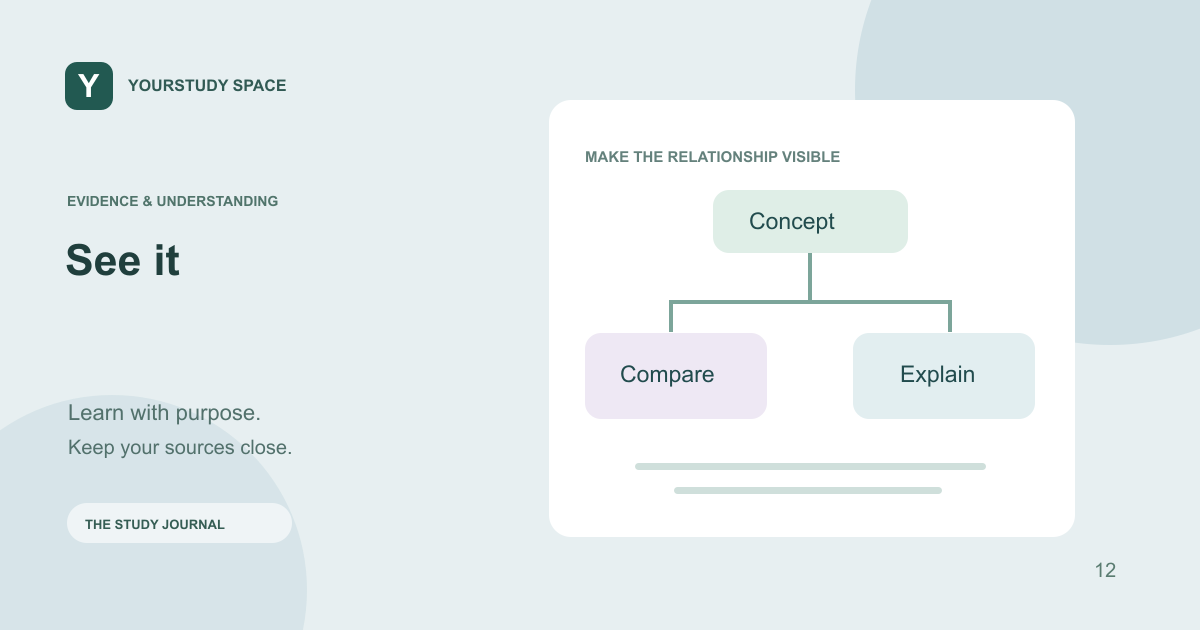
A useful diagram begins with a specific relationship. Ask for a sequence, a comparison, a branching decision or a set of ranges rather than simply naming a broad subject. “Compare these two mechanisms from my lecture” gives See it a clearer task than “Draw pharmacology.”
Select relevant Library material when the diagram should explain a particular lecture. For topic-based diagrams, inspect the public evidence provided with the result. A well-arranged image can look authoritative even when an important exception is missing.
Choose a shape that serves the question
A flow can represent an ordered process. A comparison can place related concepts beside each other. A branching layout can show how conditions change the next step. Ranges are useful when the source actually supplies numerical boundaries and units.
Do not force every idea into a flowchart. An association is not necessarily a causal arrow, and a list of options is not necessarily a sequence. If the visual implies more than the source says, revise the request or return to a plain explanation.
Check the details that carry meaning
Read every label and the legend. Verify arrow direction, units and the meaning of each color. For a range diagram, check the lower and upper bounds, whether boundaries overlap and whether the source applies to the population in the question.
A diagram cannot invent missing numerical limits safely. If the source only provides qualitative categories, use those categories rather than asking the app to guess cutoffs. Laboratory reference intervals can vary; an educational visual is not a replacement for the relevant laboratory’s report.
Use the visual as a retrieval prompt
After checking the result, explain the diagram aloud without reading the labels word for word. Identify the link you find hardest to explain and take that question to Ask or Explain. Return to the saved visual when you revisit the topic instead of generating a duplicate just to see it again.
TRY THIS NEXT
Check the arrows and numbers as carefully as the words.
Try it in the app ↗Sign-in and an active trial or membership are required for study tools.About this guide
This product guide was prepared with AI assistance and checked against the app’s implemented workflows. It is not independently clinically reviewed. Features and service availability can change. It contains no real patient information.
For study support only. Review generated content and its sources; do not use it for real-patient diagnosis or treatment. Read the study and AI disclaimer.
Found something that needs correcting? Contact the YourStudy Space team.